Three common seaborn difficulties
Explaining some aspects of using seaborn that most often confound newcomers
This post aims to explain three of the most common difficulties encountered by users of seaborn, a Python library for data visualization. My hope is that this post can be a helpful resource for users who have read through some of the documentation — which uses toy datasets and focuses on simple tasks — but are now struggling to apply the lessons to their own work.
You (might) need to reformat your data
Seaborn’s plotting functions are most expressive when provided with a “tidy” long-form dataset. With data formatted this way, you can pass the full dataset and select the columns that you want to visualize by assigning the column names to different roles (x, y, hue, etc.).
But we often work with datasets that are not naturally stored in a tidy format. For example, you might keep a spreadsheet with your household budget that looks like this:

This is a perfectly fine representation of the data from a human perspective: it’s easy to read off the change in your food expenses from year to year. But it would be difficult to plot those changes, because the “year” variable isn’t explicitly represented. Rather, it’s represented by (a subset of) the column names.

The table on the left shows the same data after “melting” into long-form format. Now the three variables are represented in separate columns and can be explicitly assigned to roles in a plot. The command for this transformation is:
budget_long = budget.melt(
    id_vars="Category",
    var_name="Year",
    value_name="Expense",
)
It can be difficult to give a general recipe for converting data to long-form, because the details will depend on the original format, and this will be different for every dataset. It can be helpful to think backwards from the plot: what will you assign to x, y, or other roles? How is that information currently encoded in your DataFrame? Once you get the hang of it, preparing your data will become straightforward. And long-form data is useful beyond seaborn: you’ll also need this format to perform group-by aggregations in pandas or to specify a design matrix in statsmodels.
But, if learning how to reformat your data still feels like an obstacle, I have good news: it might not be necessary!
I said before that seaborn is most expressive when provided with long-form data. But (nearly) all seaborn functions can understand “wide-form” data too. Wide-form data can be a DataFrame, a 2D numpy array, or even a collection of vectors (perhaps of different lengths) held in a Python dictionary or list. To understand all of the possibilities, read this chapter of the seaborn user guide. The key thing is that the values inside the table (i.e. not the index or column names) must represent a single variable.
The original budget table above won’t quite work, because it still represents one variable with one column in the table and a different variable across the other columns. But if you do budget.set_index("Category"), you’ll have a tidy “wide-form” table that you can visualize by passing to data.
The drawback is that each function has a fixed way of plotting wide-form data, and if you want to do something different, you’ll need to change the data, not the way you call the function. But it’s still useful for a quick peak.
And if you’d rather not think about pandas DataFrame structure, you can also pass vectors of data directly to x and y. You can even mix names that reference columns in data and vectors that directly represent other variables. For more complex plots, this approach may require writing a for-loop and calling the plotting function multiple times (rather than, say, using a long-form hue variable). Users of other statistical programming languages are sometimes made to feel bad for writing a for loop, but I don’t think that’s true with Python. If this approach is easiest for you, you should use it!
There are two kinds of plotting functions
The second difficulty is typically encountered when you try to combine a seaborn plot with a matplotlib figure that has multiple axes.
As you may know, matplotlib has two interfaces, The implicit interface — comprising pyplot functions like plt.plot andplt.bar— draws onto the “current axes” as tracked by an internal state machine. The explicit interface —comprising Axes methods like ax.plot, ax.bar — draws onto the specific Axes that the method is attached to.
plt.plot(x, y)  # Plots on the "current" axes, creating it if needed
f, axs = plt.subplots(ncols=2)  # Creates a new figure with two axes
axs[0].plot(x, y)  # Plots on the first axes of the new figure
plt.plot(x, y)  # Plots on the second axes of the new figure
Both approaches have their use: the implicit interface is quick and easy, while the explicit interface is (slightly) more verbose but better for making complex figures. Seaborn tries to support both styles too. Most plotting functions plot onto the “current” matplotlib axes by default and can be directed towards a specific existing Axes by setting the ax= parameter.
sns.lineplot(x=x, y=y)  # Plots on the "current" axes
f, axs = plt.subplots(ncols=2)  # Creates a new figure
sns.lineplot(x=x, y=y, ax=axs[0])  # Plots on the first new axes
sns.lineplot(x=x, y=y)  # Plots on the second new axes
Except that’s only true for most functions. Functions in a special subset , the “figure-level” functions, create a new figure every time they are invoked.
These functions, such as relplot, displot, and catplot, work this way because they internally use a seaborn FacetGrid, an object that can create a figure where subsets of the data are shown on different axes. As a result, if you do something like
f, ax = plt.subplots()
sns.displot(data, x="a", ax=ax)
sns.displot(data, x="b", ax=ax)
You’ll end up with three figures: one with an empty Axes, and two with separate histograms. Which is not what you wanted!
This behavior is explained in the user guide, but if you haven’t come across that chapter, it can be very confusing. It doesn’t help that the names don’t clearly distinguish the two kinds of functions — in retrospect, calling the figure-level functions something like relfig , catfig would have made more sense — although you can tell when kind they are by whether ax= appears in the list of parameters and by what kind of object they return.
There are a few other complexities, which the user guide chapter covers in detail. Notably, the figure size is parameterized differently in the figure-level functions, and they return a FacetGrid object, which has a few helpful methods that matplotlib Axes functions lack.
I generally recommend using the figure-level functions for most applications, but to make arbitrarily complex figures, you’ll need to switch to an axes-level function. There’s a one-to-one correspondence between each axes-level function and the different kinds of plots that the figure-level functions can make. So by default displot has kind="hist", corresponding to histplot, but displot(..., kind="kde") corresponds to kdeplot.
Categorical plots will always be categorical
Several seaborn functions specialize in creating plots where one of the axes corresponds to a categorical variable: a variable whose values do not (necessarily) bear a quantitative relationship to each other. Examples would include country of origin (which is both categorical and unordered) and age group (which is ordered, but still categorical). Such variables are often encoded with strings, and at the time these functions were created, matplotlib was not able to interpret string data. So the seaborn functions internally map from the data values to ordinal indices (0, 1, …, n), which are then passed to matplotlib.
The surprise is that seaborn’s categorical functions always do this.
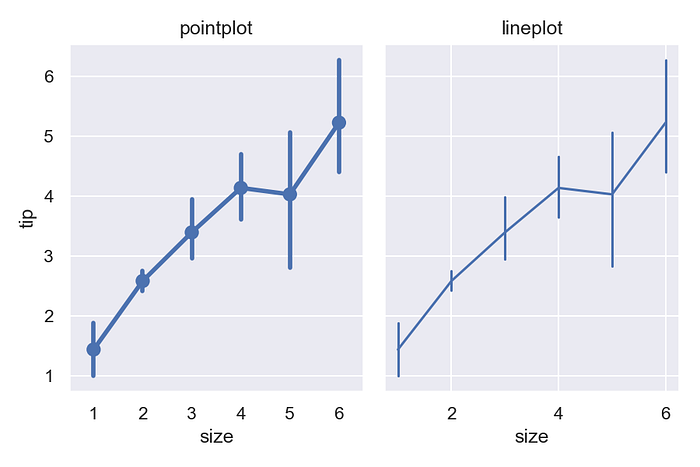
As a consequence, numeric variables will be treated as categorical. The (sorted) unique values will be mapped ordinal indices, and a label will be drawn for every value. Sometimes, this makes sense and is helpful. For example, in the “tips” dataset, the size variable is numeric, but it only takes a few evenly-spaced values, and the default tick labels that you get from the categorical pointplot are more informative than those from lineplot:
But if you draw a line with more densely-sampled values, they will all be labeled, and the x axis will be impossible to read:
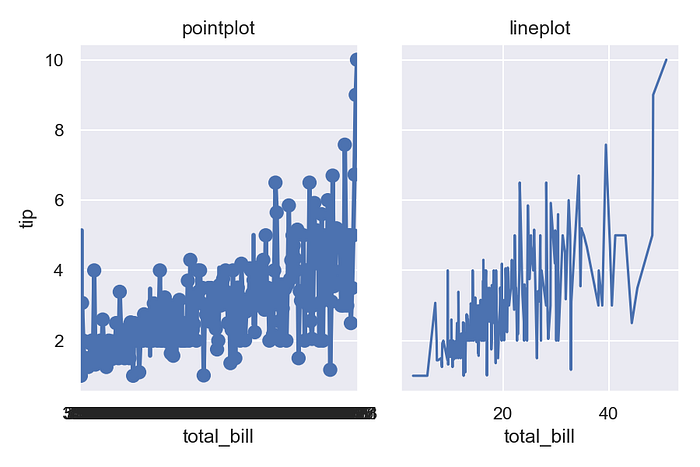
It won’t help to do ax.set_xticks([20, 40]), as that will label the 20th and 40th data points, not the data points with those numeric values (because, remember, all matplotlib sees here are the index values, not the original numbers). And even if you did set the labels properly, the plot probably wouldn’t be what you want, because each datapoint would be drawn at a fixed distance from its neighbors rather than at a distance proportional to their values.
This issue also surprises users who want to layer categorical and non-categorical functions onto the same plot. Consider the following example, which calls stripplot and lineplot with the same arguments:
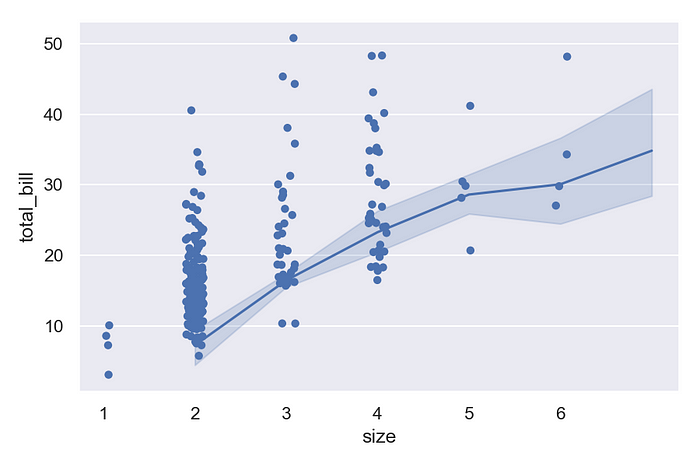
Now that you know the strips are actually drawn at 0, 1, …, n — with the tick labels set to strings representing the corresponding values — you should understand why this figure looks the way it does. But it’s a common source of surprise and confusion.
For now, my general advice would be to avoid mixing categorical and non-categorical plots on the same Axes. You can substitute pointplot for lineplot and stripplot for scatterplot where needed.
These days, most matplotlib functions can handle string data, using the same basic approach as seaborn: strings are mapped to 0, 1, …, n indices. As a result, the “non-categorical” seaborn functions can handle categorical variables just fine, and the lines between the two kinds of functions have become blurred. So it’s also possible to force categorical treatment in non-categorical plots by converting your data to strings.
The next release of seaborn will include some major enhancements to the categorical functions, which will further smooth away some of these difficulties. Notably, it will become possible to maintain the original scale of numeric (or datetime) data on the “categorical” axis. But you’ll have to explicitly ask for that, so it will be good to keep a slightly modified version of this lesson in mind: categorical plots will always (by default) be categorical.
